EventSource API

Quick Start

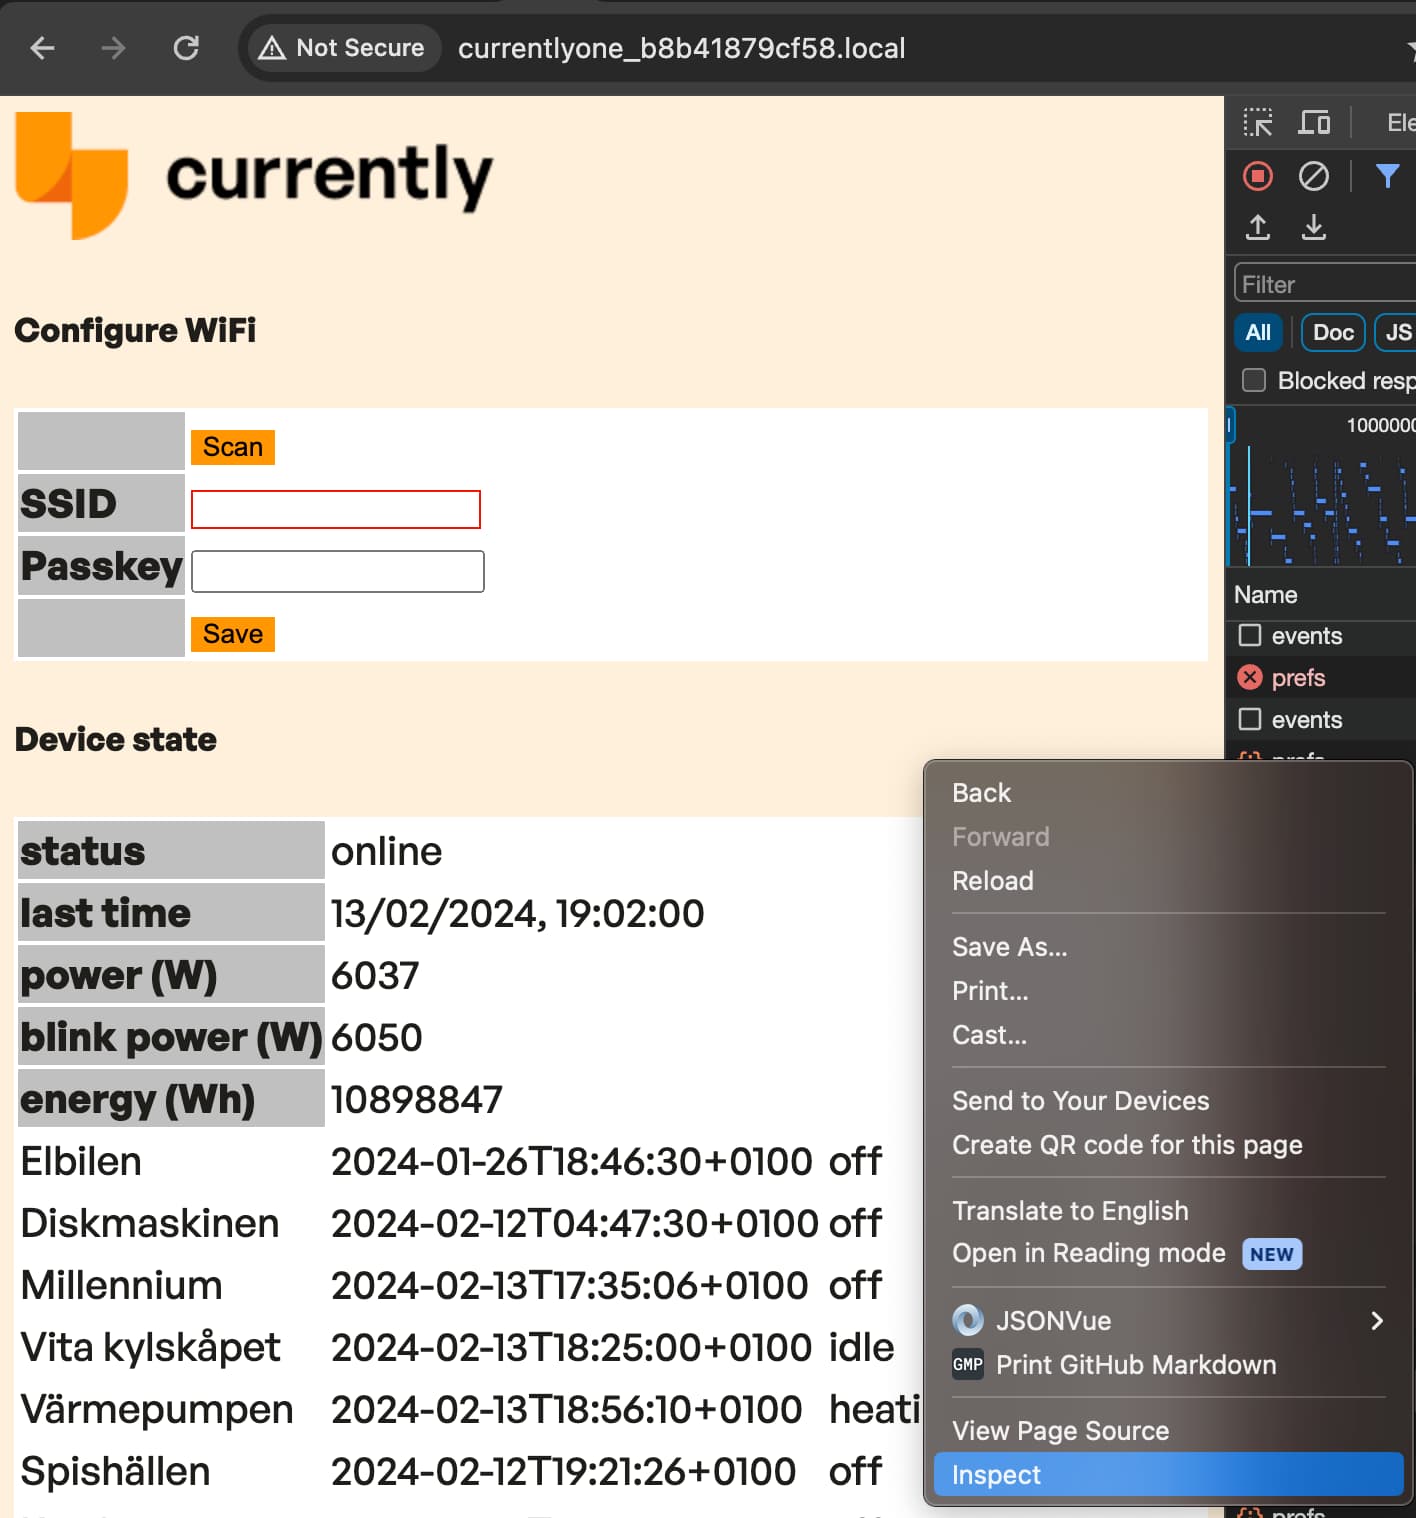
Connect to the device at
http://currentlyone_DEVICEID/events
or
http://IP_ADDRESS/events
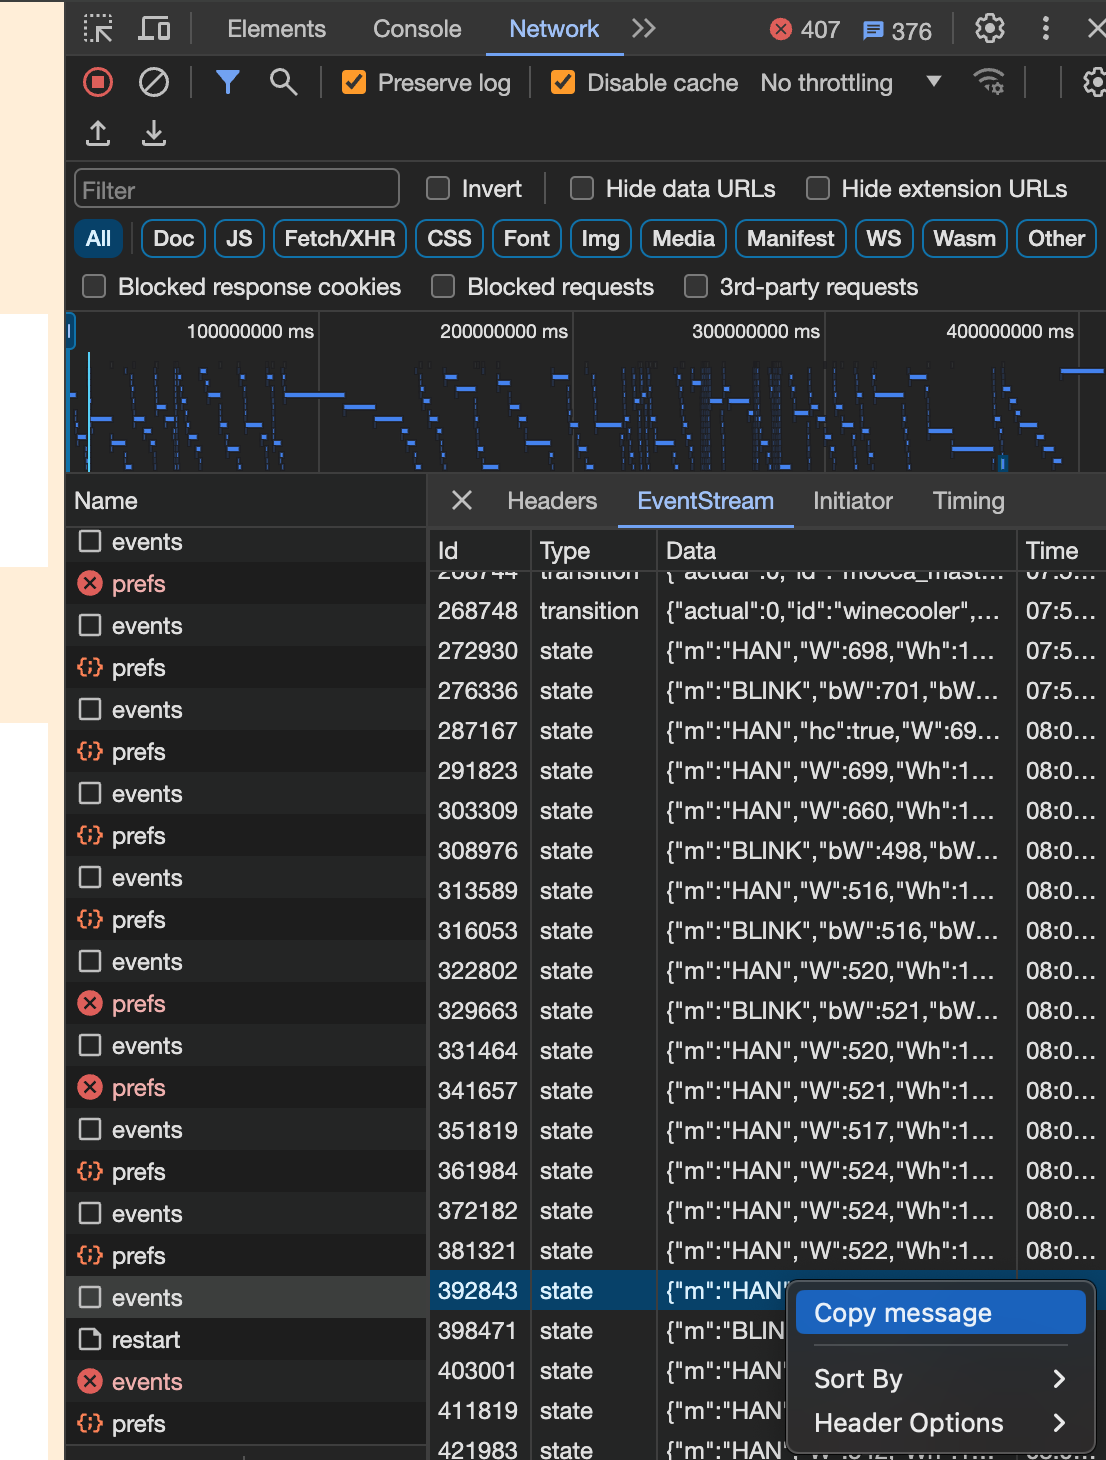
and consume the stream of events. It has the following structure:

status online
config {"id":"b8b41879cf58","v":"2.0.25","m":"HAN","ssid":"DLink2.4GHz","localIP":"10.0.1.122","mqtt":"***","name":"b8b4 HAN", "imps":1000,"crc":"verify","autoFota":"auto","pullup":"disabled","t":"2023-10-12T19:59:33+0200","rr":"SW","rssi":"-87"}
state {"m":"ALL","t":"2023-10-03T23:39:20+0200","sec":1696369160,"detected":[	{"id":"byd_charge","to":0,"algo":0,"Wh":31537}]}
state {"m":"HAN","t":"2023-10-12T18:54:20+0100","W":757,"Wh":2950419,"Ph":0,"Rh":422573,"Qh":1400936,"P":0,"R":0,"Q":521,"L1":373,"P1":0,"R1":0,"Q1":300,"I1":2.000,"U1":232.500,"L2":75,"P2":0,"R2":0,"Q2":155,"I2":0.700,"U2":233.000,"L3":308,"P3":0,"R3":0,"Q3":65,"I3":1.300,"U3":235.200,"sec":1697133260,"csW":0.253,"csR":0.040,"csL1":0.326,"csR1":0.076,"csL2":2.336,"csR2":0.044,"csL3":-0.619,"csR3":-0.426}
state {"m":"HAN","t":"2023-10-12T18:54:30+0100","W":752,"Wh":2950421,"Ph":0,"Rh":422573,"Qh":1400937,"P":0,"R":0,"Q":521,"L1":371,"P1":0,"R1":0,"Q1":300,"I1":2.000,"U1":232.800,"L2":74,"P2":0,"R2":0,"Q2":155,"I2":0.700,"U2":232.400,"L3":306,"P3":0,"R3":0,"Q3":65,"I3":1.300,"U3":235.300,"sec":1697133270,"dL2":0,"csW":0.035,"csR":-0.047,"csL1":0.137,"csR1":0.009,"csL2":1.634,"csR2":0.026,"csL3":-0.588,"csR3":-0.431}
...
log {"m":"HAN","t":"2023-10-12T18:54:30+0100","W":752,"Wh":2950421,"Ph":0,"Rh":422573,"Qh":1400937,"P":0,"R":0,"Q":521,"L1":371,"P1":0,"R1":0,"Q1":300,"I1":2.000,"U1":232.800,"L2":74,"P2":0,"R2":0,"Q2":155,"I2":0.700,"U2":232.400,"L3":306,"P3":0,"R3":0,"Q3":65,"I3":1.300,"U3":235.300,"sec":1697133270,"dL2":0,"csW":0.035,"csR":-0.047,"csL1":0.137,"csR1":0.009,"csL2":1.634,"csR2":0.026,"csL3":-0.588,"csR3":-0.431}

You can see these are similar to the data published to the MQTT broker, as described in MQTT protocol / API

Event Types

The device writes the following event types to the EventSource:

  • status
  • config
  • transition
  • hourly
  • state
  • log
  • progress

status

The status message body online, and comes at the beginning of the stream.
Body fota comes when FOTA begins.
Body restart comes when the device is about to restart.

config

The config message arrives as the second message on the stream, and only once:

{
  "id": "abcd1879cf58",
  "v": "2.8.9",
  "m": "H+B",
  "area": "SE2",
  "ssid": "dLink2.4",
  "localIP": "192.168.1.122",
  "mqtt": "",
  "remoteUrl": "https://c1.casamia.net",
  "name": "Casa Mia",
  "imps": 1000,
  "crc": "verify",
  "autoFota": "disabled",
  "pullup": "internal",
  "t": "2025-03-12T09:50:53+0200",
  "rr": "SW",
  "rssi": -82,
  "txPwr": 76
}

hourly

The device can store up to the 64 latest hourly readings in RAM, and they are written to the stream when connected as follows:

{"sec":1744318801,"Wh":30095650,"Ph":0}

{"sec":1744322401,"Wh":30097430,"Ph":0}

Subsequently, hourly readings are written to the stream on every new hour.

state

The device can store up to the 32 latest state readings in RAM, and they are written to the stream when connected as follows:

{
  "m": "HAN",
  "W": 606,
  "Wh": 30107340,
  "t": "2025-04-11T08:48:00+0100",
  "Ph": 0,
  "Rh": 8620089,
  "Qh": 5360216,
  "P": 0,
  "R": 0,
  "Q": 358,
  "L1": 248,
  "P1": 0,
  "R1": 0,
  "Q1": 235,
  "I1": 1.400,
  "U1": 236.000,
  "L2": 317,
  "P2": 0,
  "R2": 0,
  "Q2": 75,
  "I2": 1.300,
  "U2": 234.800,
  "L3": 40,
  "P3": 0,
  "R3": 0,
  "Q3": 47,
  "I3": 0.200,
  "U3": 237.700,
  "sec": 1744357681,
  "dR2": 0
}

Subsequently, state readings are written to the stream on every new telegram received from the Electricity Meter. These messages are also known to represent the real-time data.

log

log messages are free-form logging strings, used to observe and debug.

currently/one/winecooler/detect {"actual":82,"id":"winecooler",

progress

progress messages are typically sent during FOTA download, and are used to display a progress bar in the web interface.

transition

The transition messages are written when an individual appliance changes state.

{
  "actual": 0,
  "id": "mocca_mast",
  "bs": "OFF",
  "W": 0,
  "Wh": 1746,
  "sec": 1744348831,
  "t": "2025-04-11T07:20:31+0200",
  "dName": "Mocca Master",
  "sName": "off",
  "trigger": "",
  "algo": 0,
  "from": "off",
  "delta": 0,
  "cat": "coffee-makers"
}

Manually inspecting the EventSource

You can inspect the EventSource using your browser, e.g. Chrome.

  1. Open the Network inspector by right-clicking the index web page:

  2. Chose the Network tab (the 3rd or 4th):

  3. Select the latest events file (Name column)

  4. Right-click a recent state event and Copy message:

Now you have the JSON representation of the event on your clipboard, e.g.:

{"m":"HAN","W":533,"Wh":10873784,"t":"2024-02-13T08:01:50+0100","Ph":0,"Rh":3262987,"Qh":2061467,"P":0,"R":0,"Q":394,"L1":254,"P1":0,"R1":0,"Q1":221,"I1":1.400,"U1":229.000,"L2":237,"P2":0,"R2":0,"Q2":130,"I2":1.100,"U2":229.800,"L3":40,"P3":0,"R3":0,"Q3":42,"I3":0.200,"U3":232.300,"sec":1707807710}

The EventSource messages and MQTT messages share the same format and contents.