Starting version 1.14, the app is showing top-three-most-expensive Appliances usages in the hourly stacked bar chart in the Analysis tab:
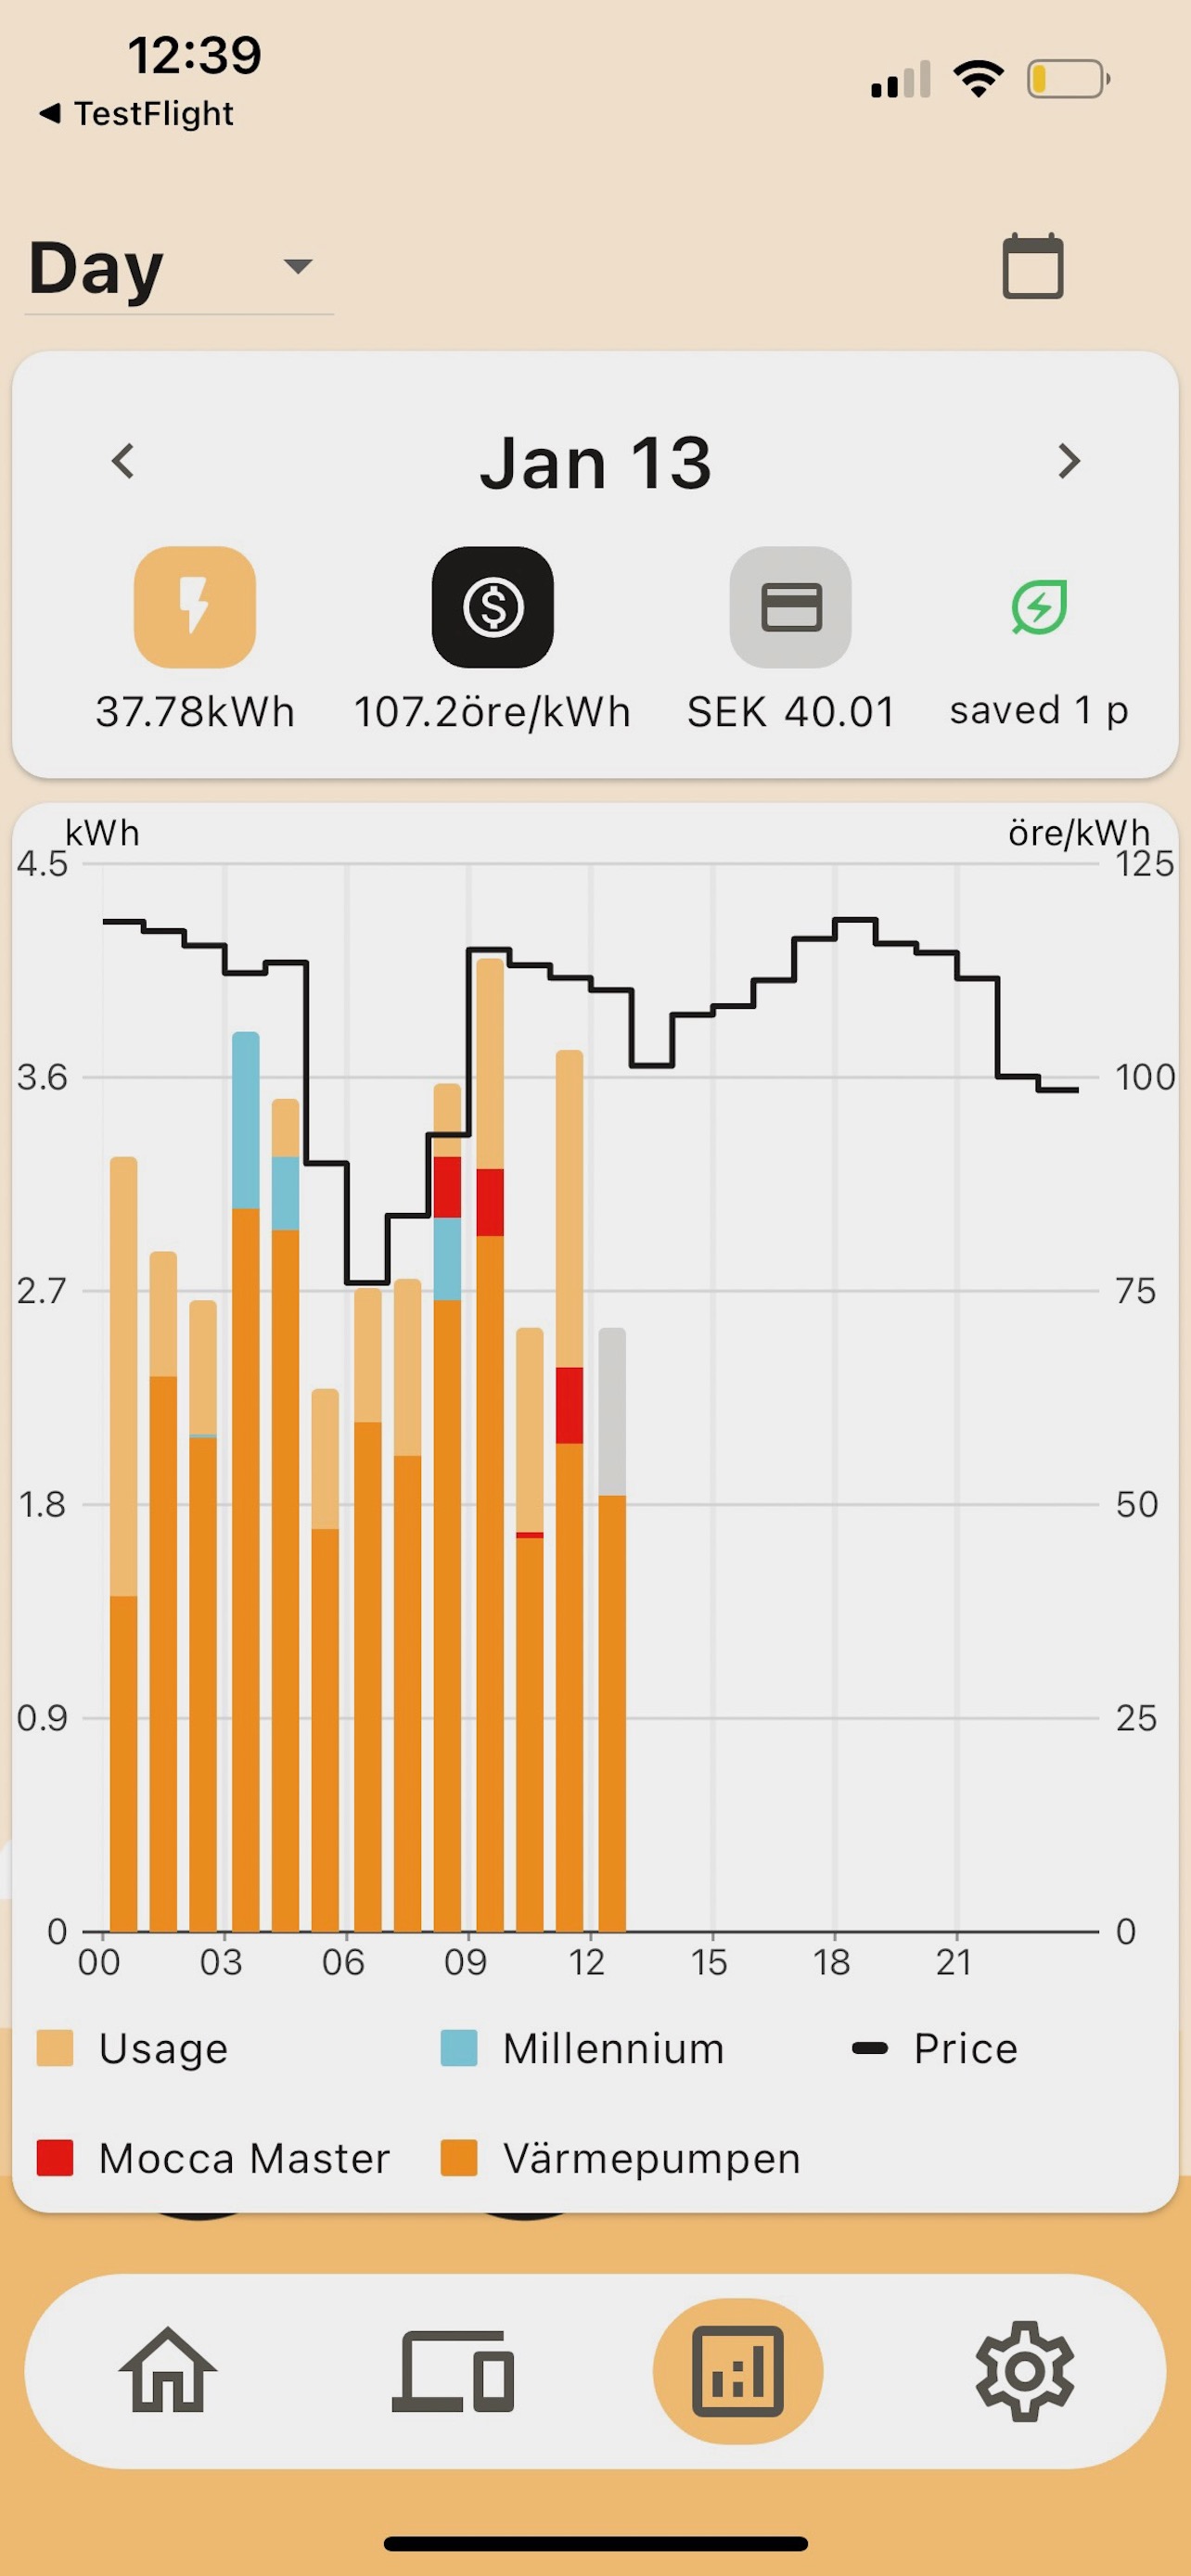
The most cost-driving appliance so far today is at the bottom in the stacked bar, the orange “Värmepumpen” in the example above.