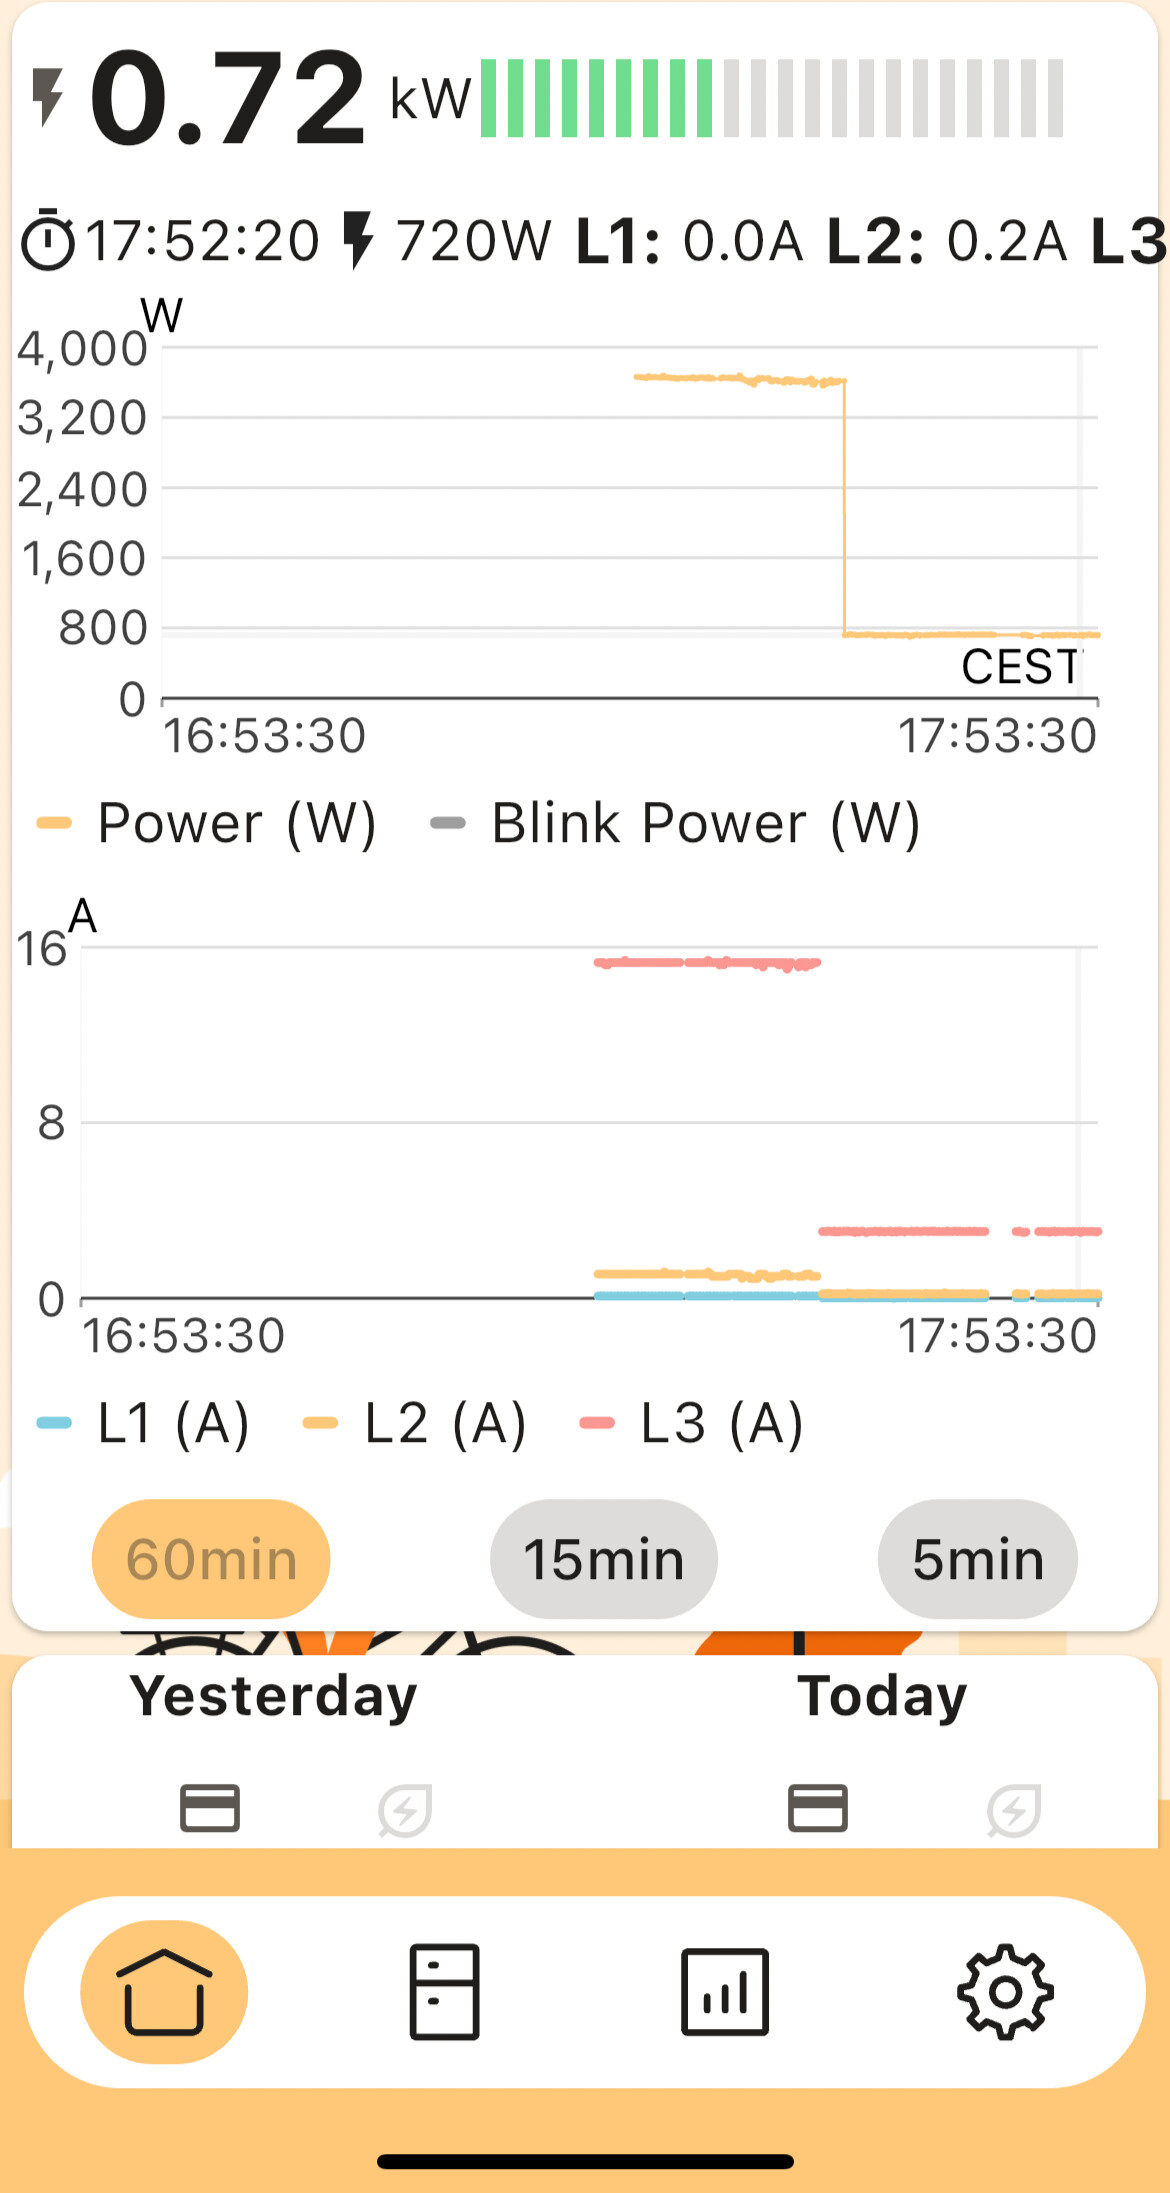
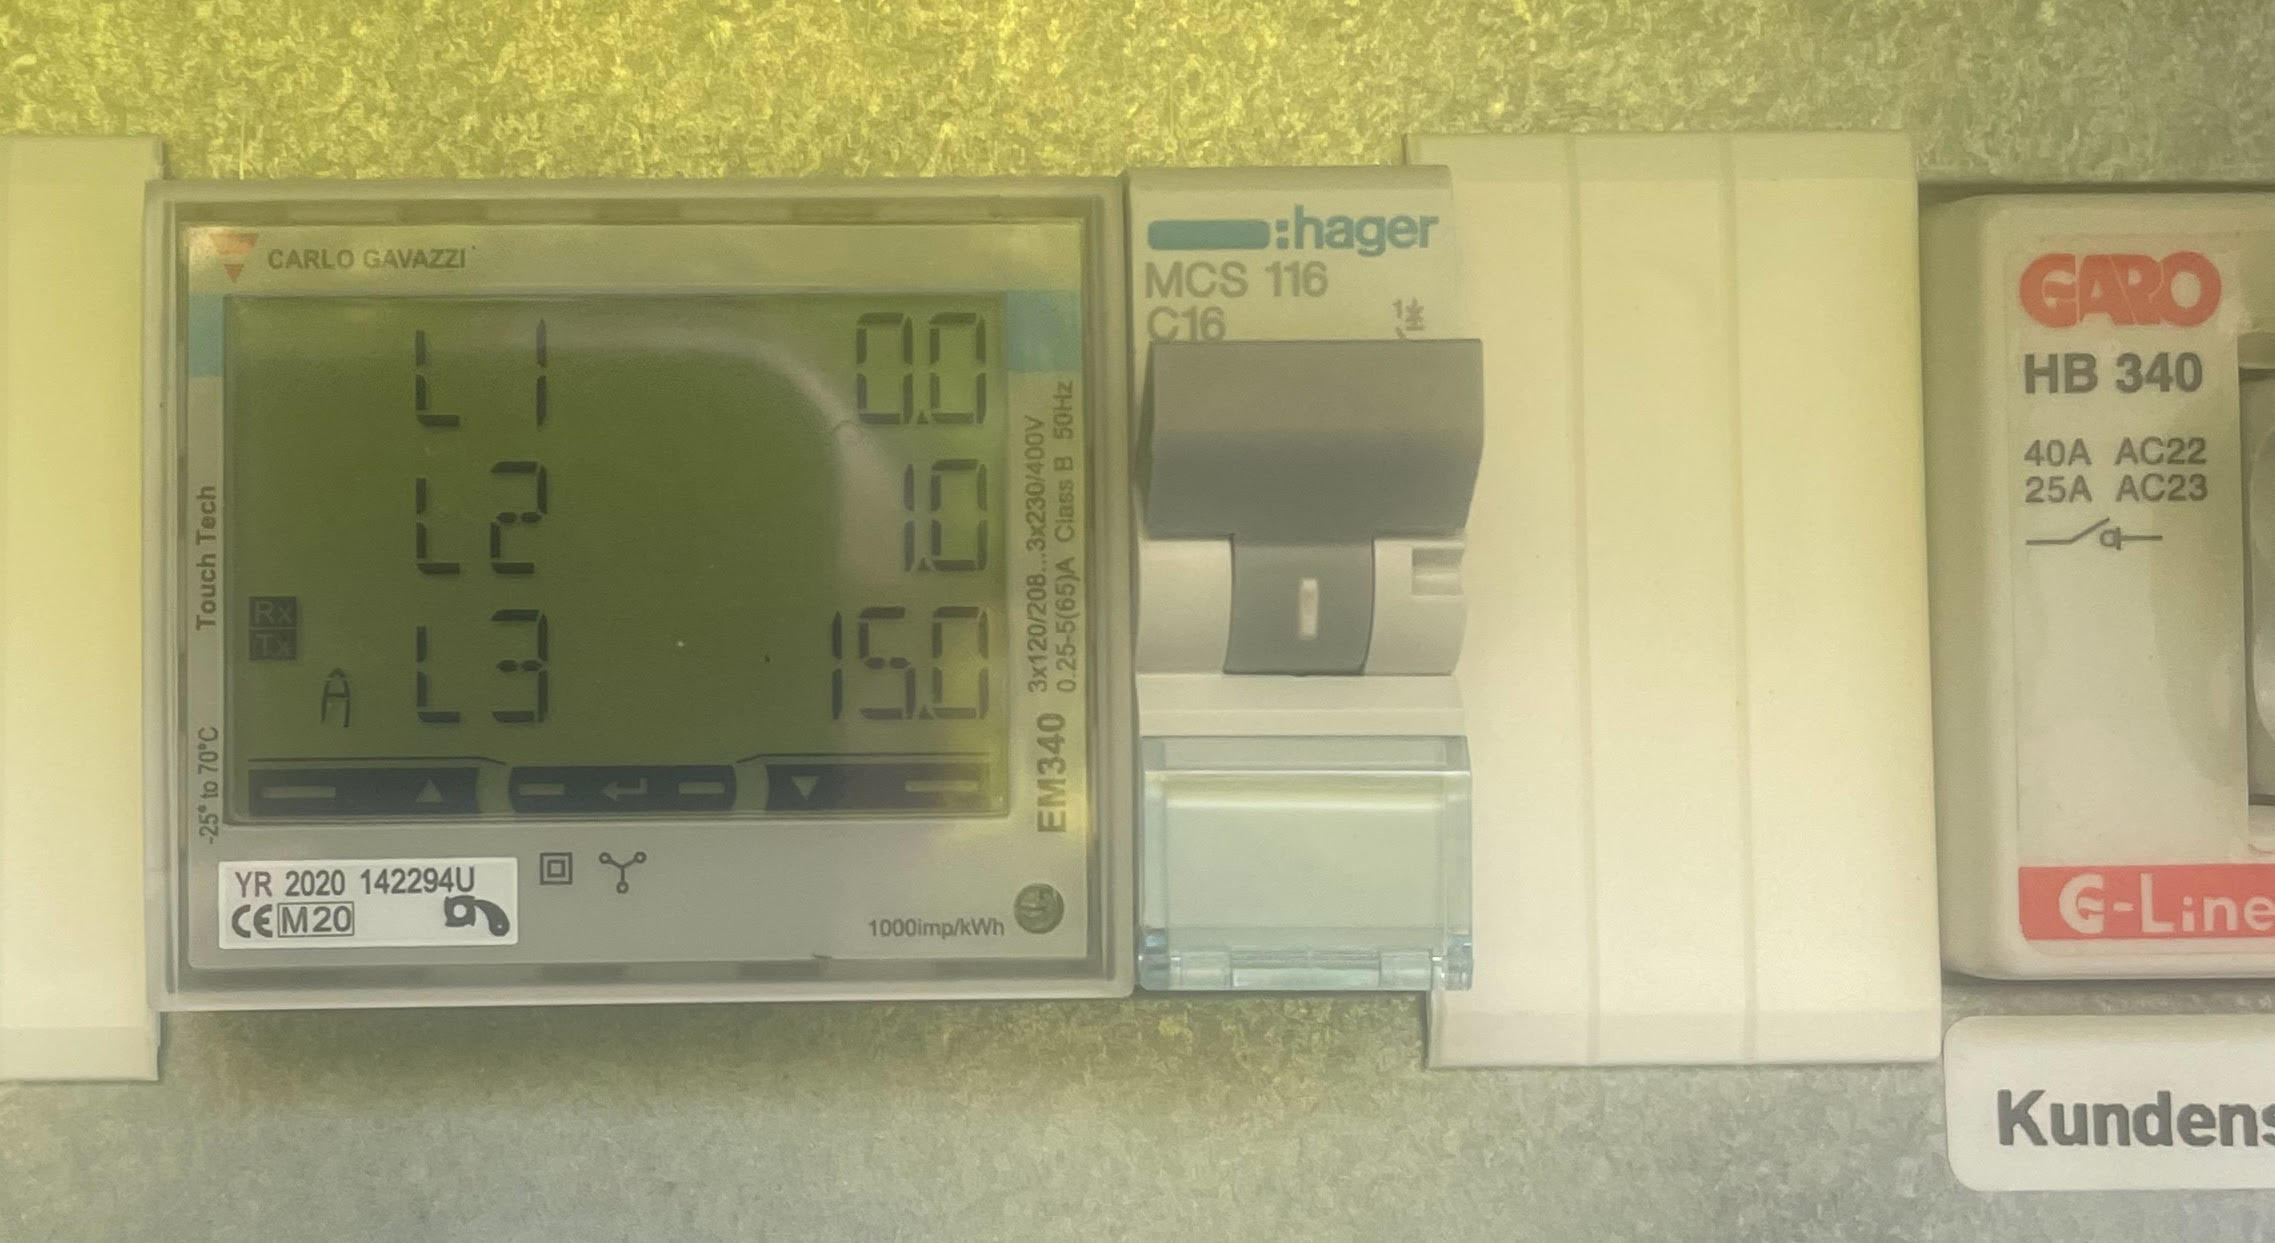
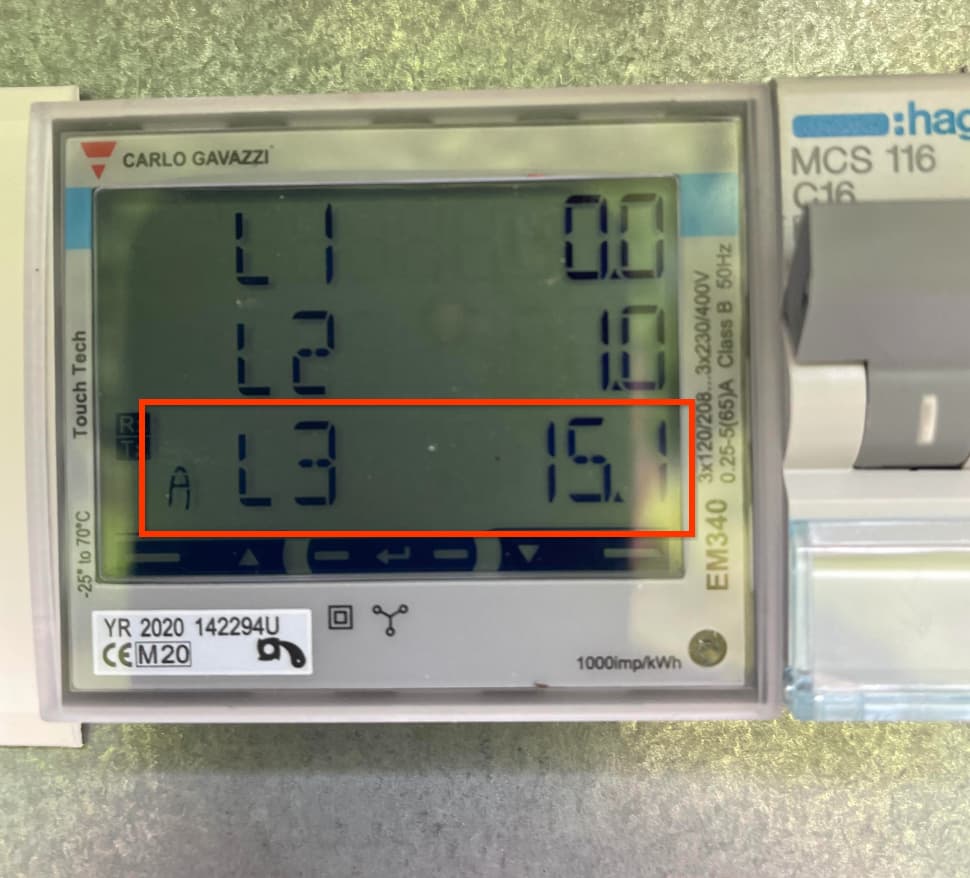
I got my device and set it up now. Something is not right with the amperage usage detection. See the pictures which show that one phase is using 15A while I’m charging my car, while the app shows 3A. It did show the 15A for some time, but then it dropped (around 17:52 / 17:53 and stayed like that…).
Needless to say that the car was still charing at that time, the load balancer I have installed has an LCD and it still showed 15A usage.
What kind of data is shown in the amperage graph? I have a 20A main fuse for the house and I’m the most interested in seeing when/if the total Amperage usage goes near 20A, to be able to figure out how to better balance the house. But at this moment the amperage graph is misleading.
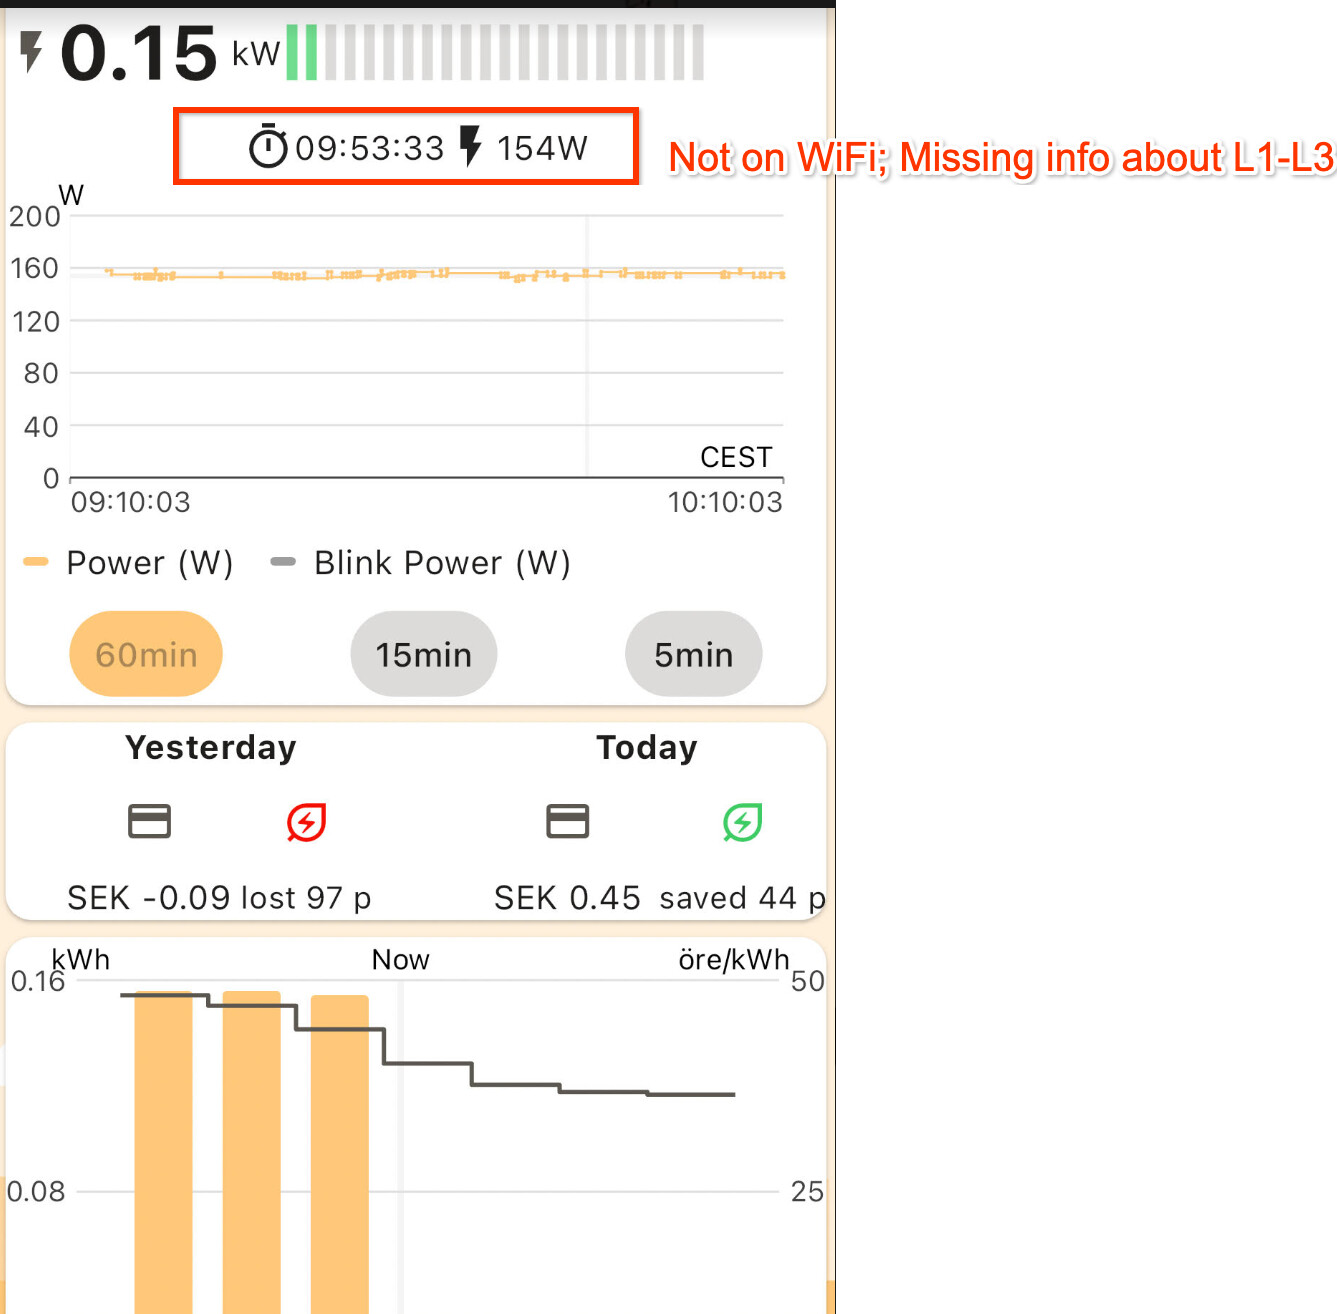
Moreover, the U.I. in the iPhone app is not scaled correctly, it cuts displaying L3. Can this be fixed too?
You can see the time 17:52 / 17:53 is the same day n both pictures. The real consumption did show for a few minutes, with L3 showing 15A, but then it dropped and stayed like that…
Hi,
as the Currently One device is simply relaying the various numbers like power (W) and amps (A) from the electricity meter, I would try to get hold of the raw OBIS feed from the meter (Hur kontrollerar man vad elmätaren skriver på HAN-porten?) using the telnet port. Maybe the meter and the load balancer are out of sync.
The amps graph shows the selected time interval (60/15/5 mins) and the three phases there, scaled so that the max value is shown.
Re scaling, perhaps you have chosen a larger font size in iOS, and that’s why L3 is cut?
I’d like to reply to your message while touching on three topics.
Regarding the UI, I do use larger fonts as many of us do (probably). But instead of cutting off the information on the app, it should just break them in into a new line. Can you fix this in the app? Other mobile phone apps handles this issue gracefully.
Secondly, once I’m off Wifi, the graph does not show the Amperage consumption Could you fix that too please? See on e of the attached pictures.
I’m a tech guy, using SSH and Telnet almost on the daily basis. But I don’t want to get into the weeds of this. I just want a hardware/app that works out of the box.
I have searched months and months the Swedish and other markets to see which product should I use and I decided to use Currency as you are a bit ahead of the competitors. I’m not sure what your business model is, but if you are going to cater only to tech-savvy users, you are going to lose out in my humble opinion. Instead you should cater to all type of users, those who just want things working out of the box, or with minimum tech intervention, and those who want to dig into the deep underbelly of the technology
Furthermore, the idea of crowdsourcing is a good one, if the crowd is BIG and technical enough to help grow the product further. Looking at the existing devices database, I see only a few created, none of which I and probably others can use.
Hence, I really suggest to create some standard devices that all of us can use, giving an incentive for less technical users to buy your product and start using it. By standard products that mean a ‘standard coffee maker for 1100W’ for example which has simple ON/OFF/Cooffee-maker functions. An another example could be ‘a standard air conditioner unit of let’s say 2000W’ which has heating and cooling functions’ and so on so forth. These then could be used by everyone who uses your product and services and would like to test these out without needing to learn to create complex transitions and such to create a device.
Lastly, I would like to get back the the graphs showing the Amperage. I really believe that the app is showing the wrong details. I have checked this with my car charging at 15A and checking the LCD of my small load balancer which actually shows 15 Amp consumption as the car does. So the 2 are perfectly synchronised.
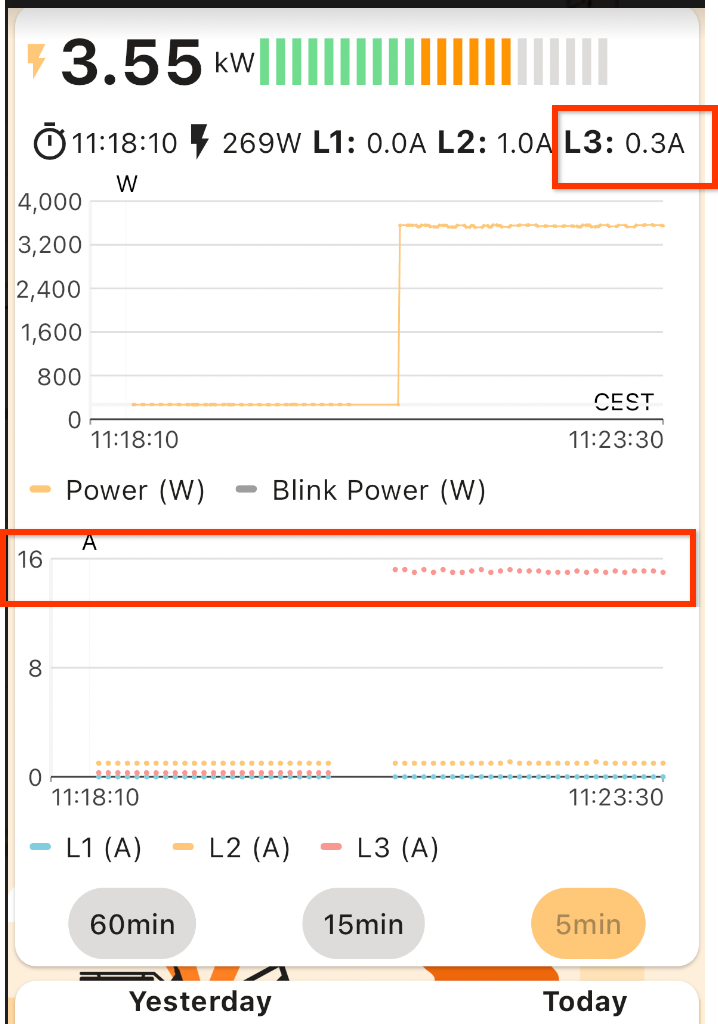
But the Currently app shows much less than that unfortunately in the top side (see the attached pictures), while in the graphs you can clearly see the red L3 shows 15A. Could you fix the app so it shows the right Amperage values?
If you do not want to help debugging this, we will not be able to investigate your specific issue.
In order to look into this from our side, you have to reproduce the mismatch issue again, and take note of the date and time of the mismatch. Then we can check the server logs and data in database.
The realtime data is persisted for seven days only, so I am afraid your original issue has been deleted our side.
Regarding the cost for shuffling the data via the cloud server, can we reduce the cost perhaps by not exposing the Amperage data every second, but only when there is a ‘bigger’ fluctuation?
Moreover, we do already expose the same Wattage related data 2 times, one time in the top of the graph in kW, and one line lower in W. Maybe exposing the same data twice is not an additional cost, not sure, just trying to find an alternative here to reduce the cost which seems to be the biggest impediment to improve our user journey.
Regarding Telnet, I can help you debug this, my only ask is for you to walk me through the process, i.e. provide me the exact commands you’d like me to run and what data to share with you and how.
Thanks again for the reply Andrea and for pointing me to the other detailed article.
I’ll extract the logs as soon as I’m at the location and share it with you for further troubleshooting.
Here are the logs:
0-0:1.0.0(240614121110W) - I believe that this is what you wanted. It is cumbersome to copy/past the info out fr m Telnet Lite on a amAc, as the logs are constantly updating and that particular line is changing, AFAIK.
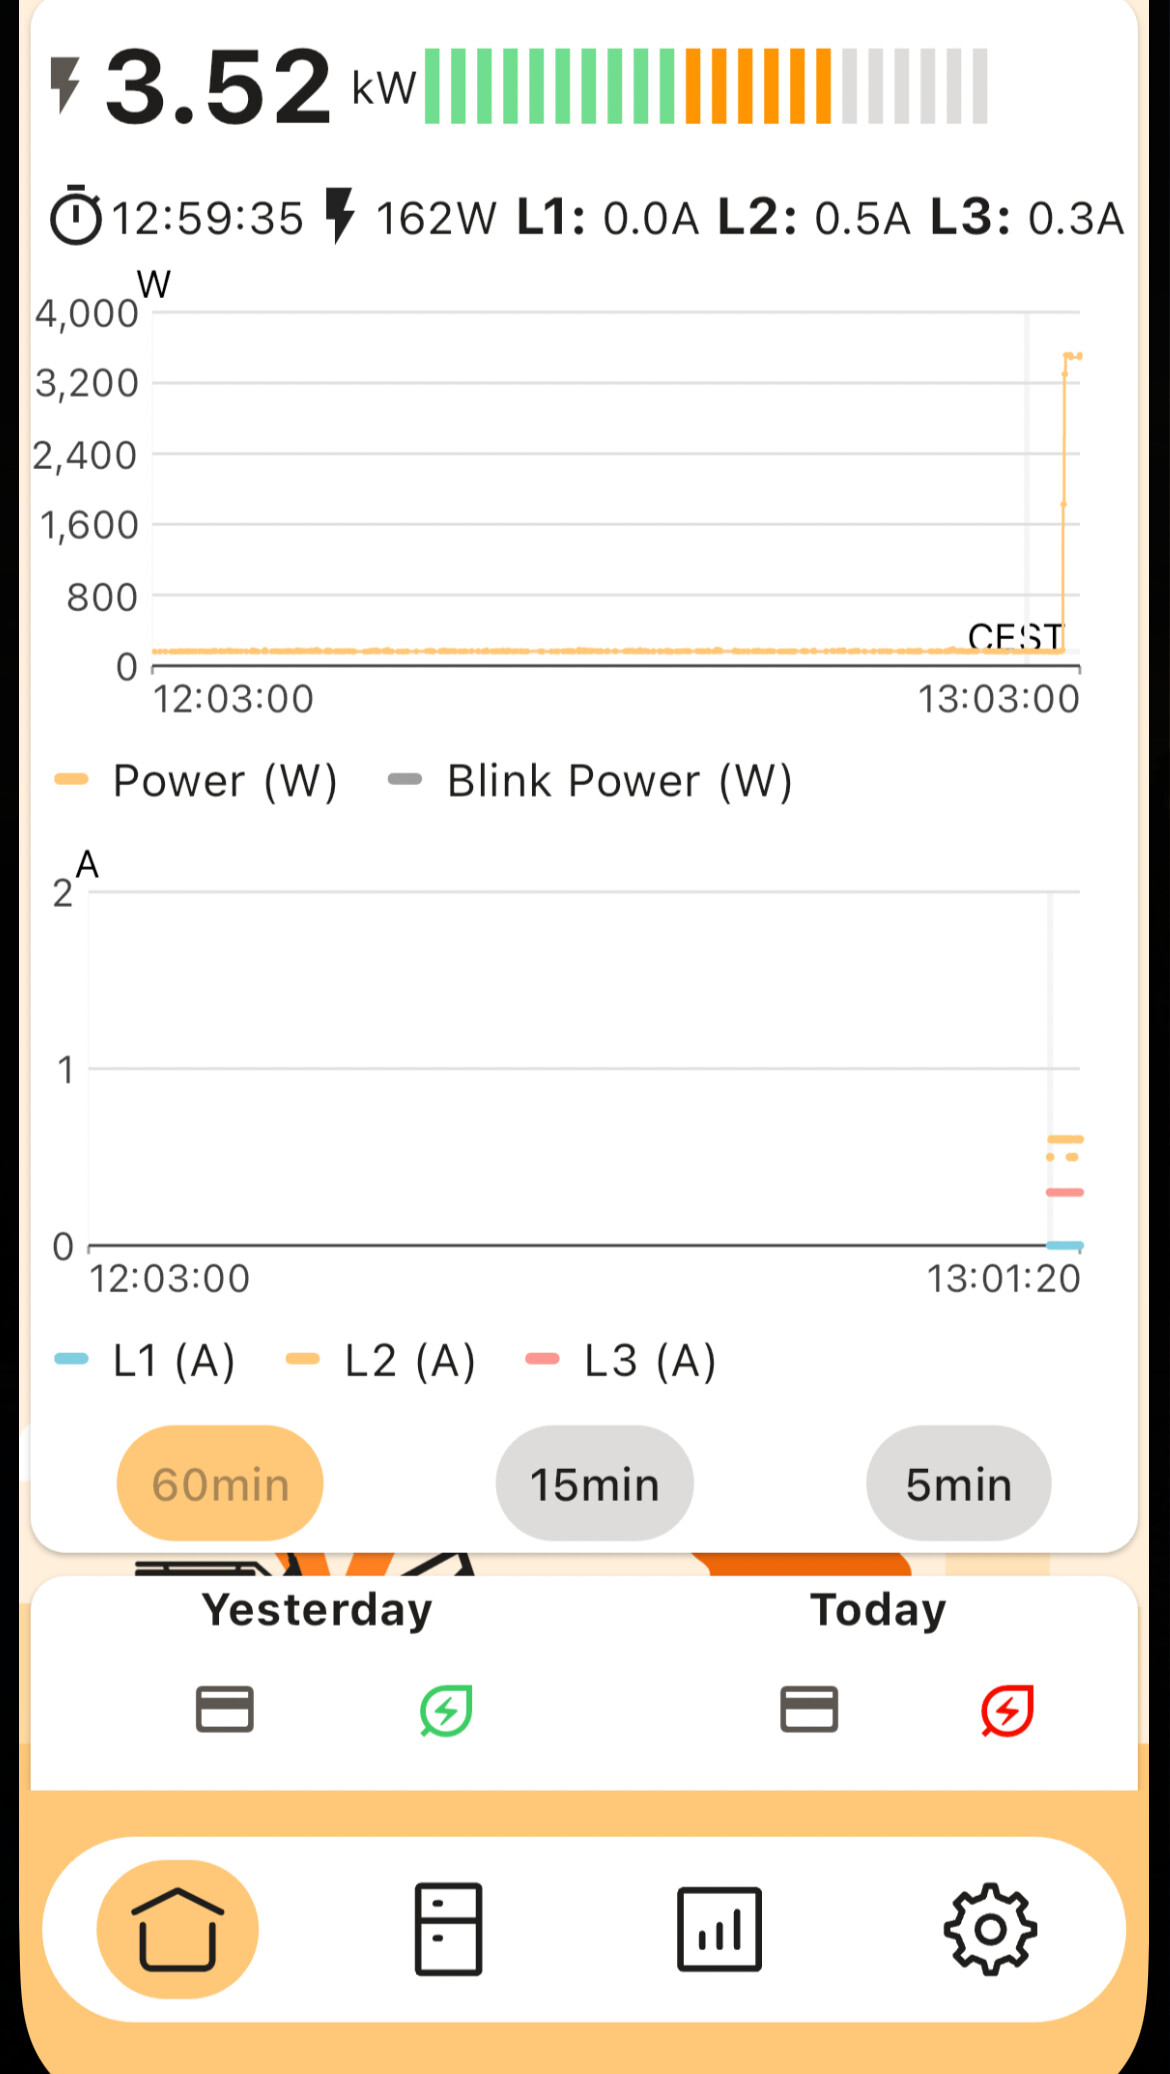
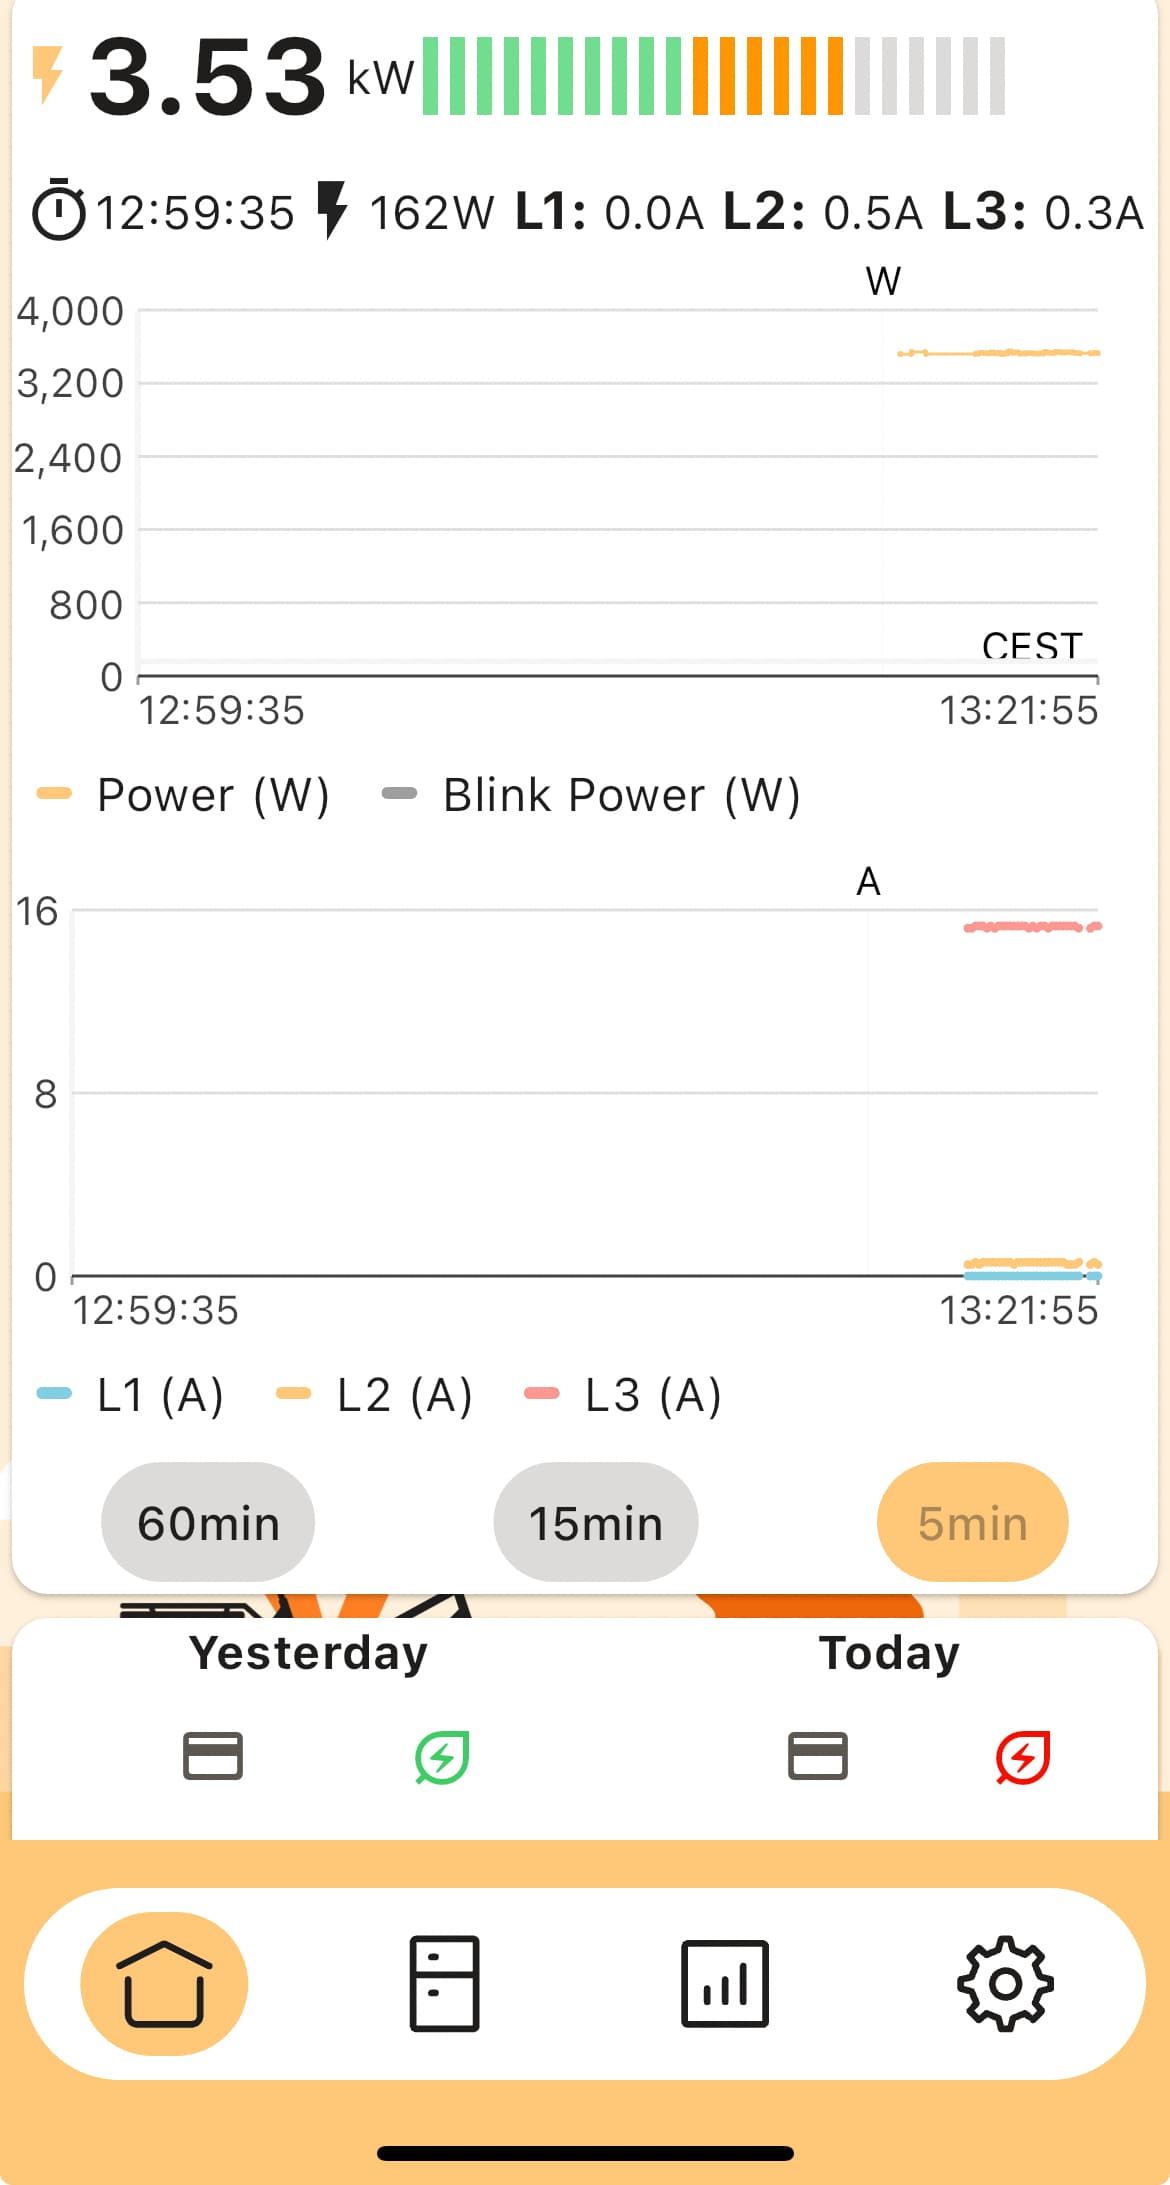
As you can see in the last lines I see that one L3 is at 15.2A consumption, while the app shows me a totally different number for it. L1 and L2 do match though. As you can see in the 2nd picture, after a while the lower graph show the right number for L3, but the upper one does not, while the log still shows the same number.
The timeline is 13:05 PM on the 14th of June
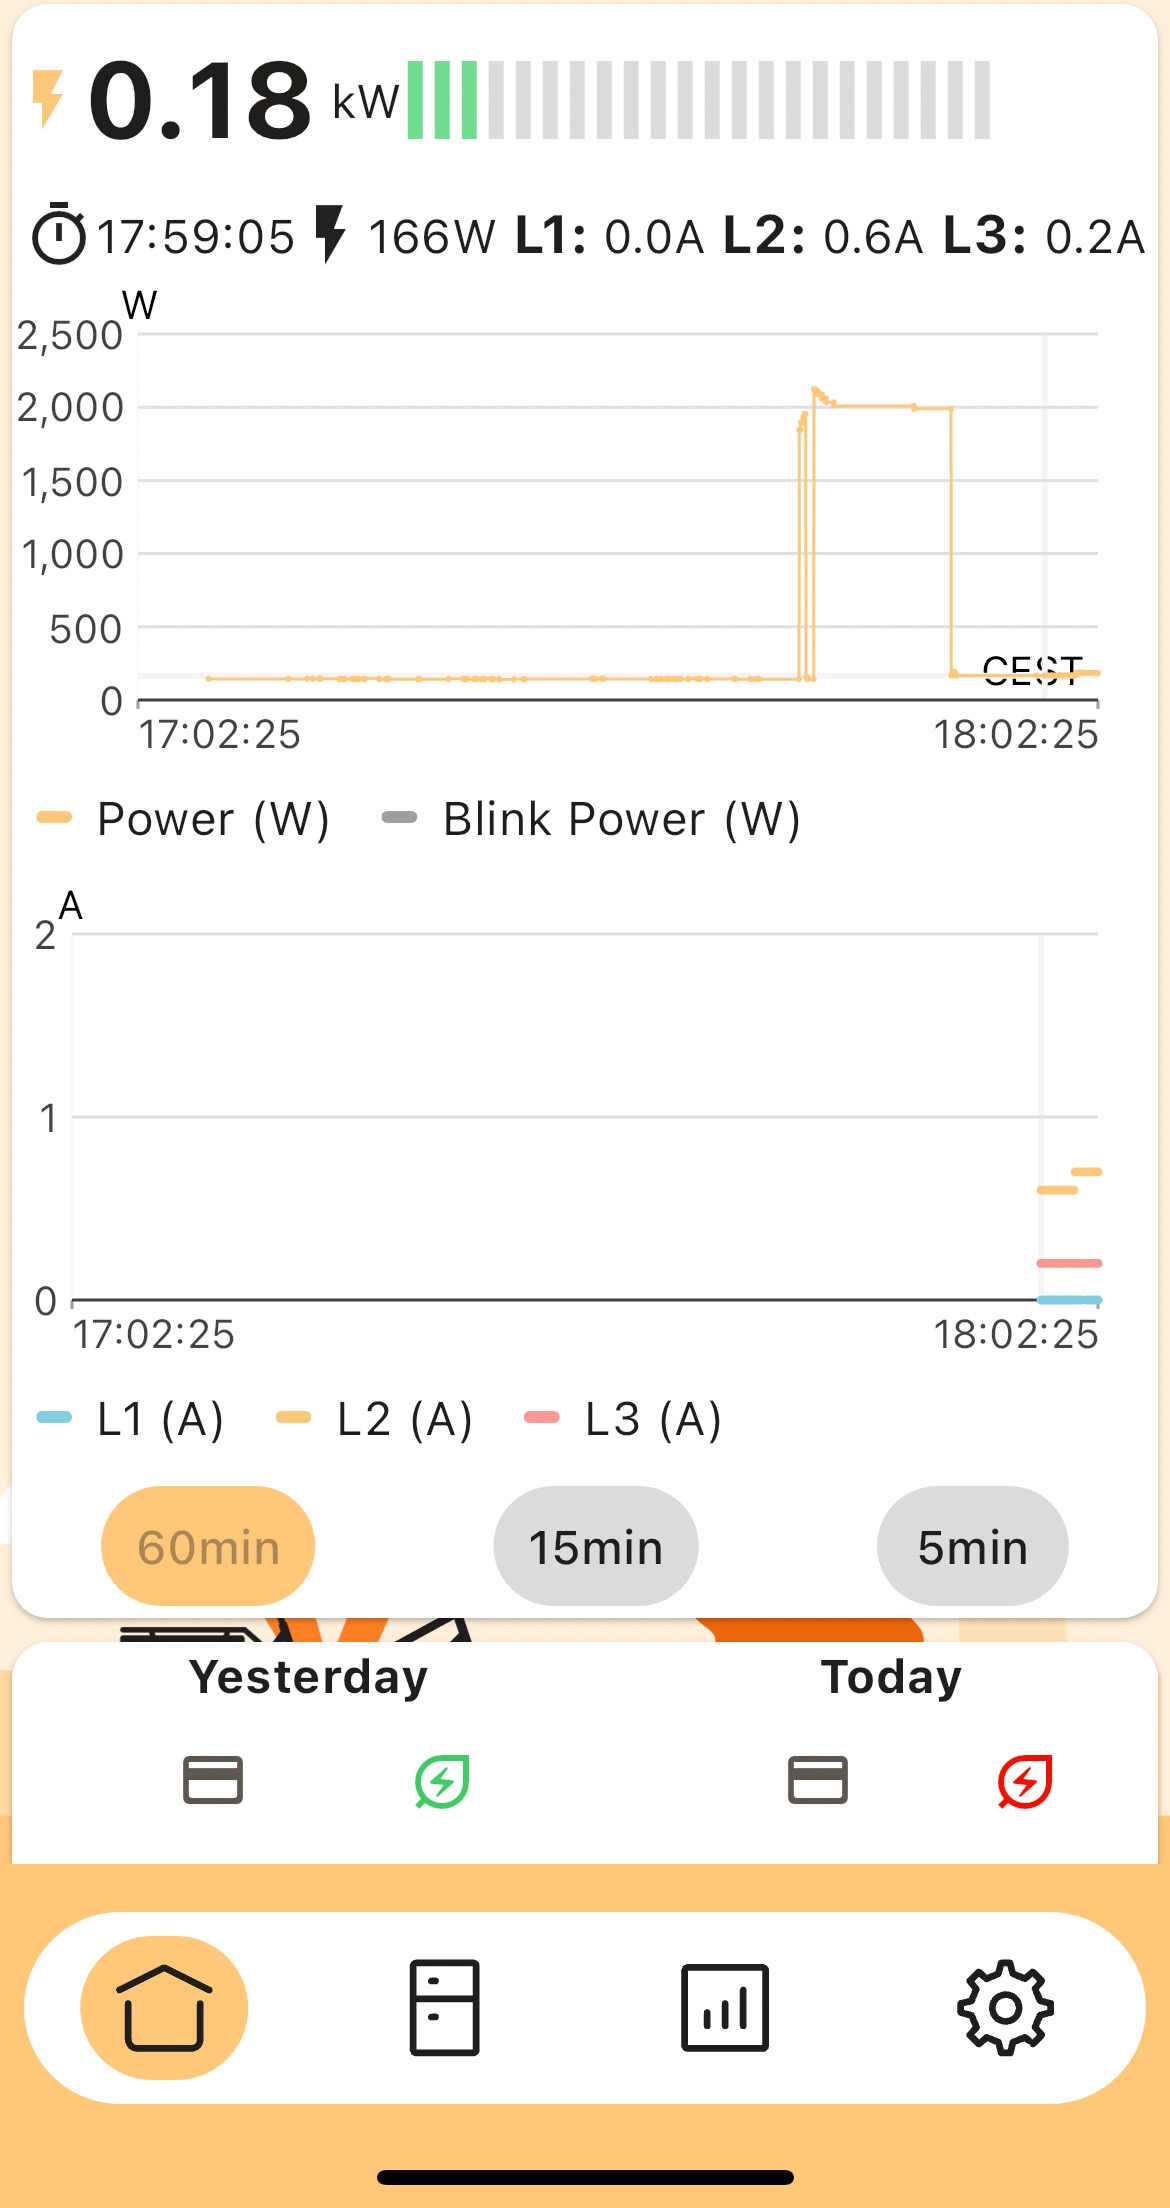
Update: This discrepancy happens an all phases. See an another example below (taken at 18:02 on the 14th of June). L2 should show 9A consumption, but it does not:
The “details” row with timestamp, total power, L1, L2 and L3 amps shows the values at the cursor, which you can move in the graph. These values do not update in realtime, only the graph does.
Your telegram provided is for 240614121110W, i.e. 13:11:10 CEST.
The 2nd picture shows these values in the graph, but you still have the cursor at 12:59:35, hence the L3 value of 0.3A
Thanks for the answer again.
This is very very confusing and contra intuitive and I might say disappointing.
The very top section of the page shows in huge number the ‘live’ consumption, am I right? Which is gr8 and this is what a such app should show.
So in this case the Amperage usage below this wattage usage number, in the same section of the U.I., it should also show ‘live’ data. Otherwise what is the point for it. Fiddling with the cursor to show live data is not a good concept (if I understand correctly how this should work).
Moreover, I can say that while charging the car for several hours, I went back to the app from time to time and the Amperage number did not update during this several hour charging window. So at least when re-opening the app a few hours later, it should show the real/updated Amperage consumption with the cursor jumping to that time when you re-opened the app.
Could you change how the Amperage data is displayed? This is the main feature of the app, to show ‘live’ data, especially when the app is in the Wifi range of the device.
Although I would like to ask the team to find a solution to show this Amperage usage ‘every now and then’ even outside of the wifi range of the device (pertaining to our cost related info discussion we had previously).
Thank you for taking into consideration both my suggestions in this thread (currents & total fuse load) and implemented them in the new version of the app. I just wished that a free version would have existed for these features too…
I just discovered a bug with the subscription.
I have cancelled my subscription now… but cancelling should still allow you to have the features for the remainder of the month since you already paid for it. But as soon as you cancel, the amperage data disappears from the graph
Since these extra features cost money when remote, could we add realtime updates to the “details” row with timestamp, total power, L1, L2 and L3 amps when connected locally to the device? This way we would not need to fiddle with the cursor to see the live numbers.